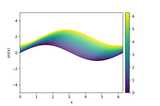
 How to use LineCollections in Matplotlib
First, import the necessary modules:
import numpy as np
import matplotlib.pyplot as plt
from matplotlib.collections import LineCollection
Then generate some data to plot:
x_array = np.linspace(0,2*np.pi,30)
y_arrays = [np.sin(x_array-i*0.2)+0.3*i for i in x_array]
Choose a colormap …